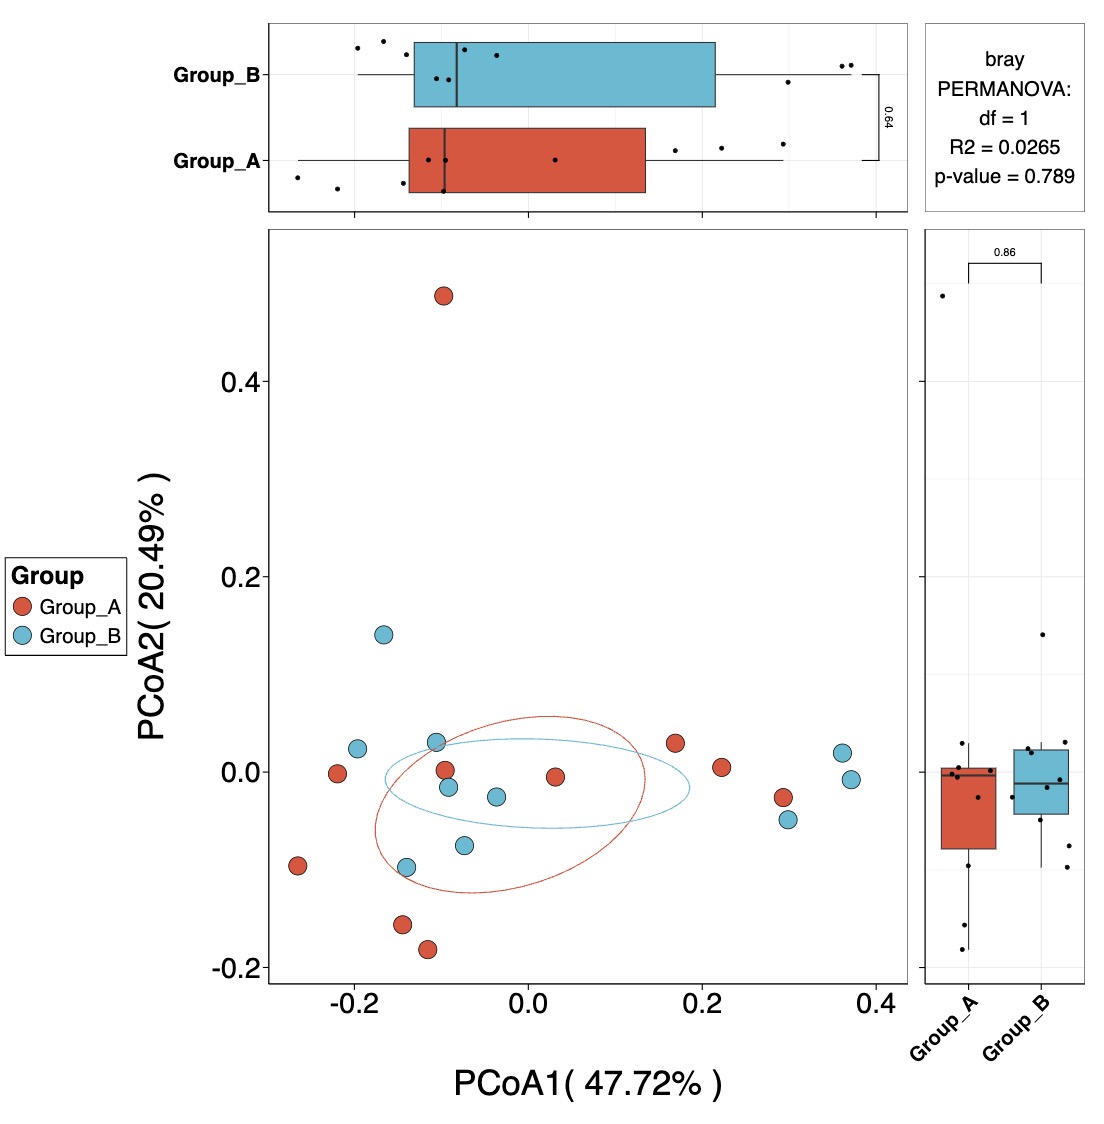
8.2 散点图 EMP_scatterplot
散点图是用笛卡尔坐标系上的点表示二个或多个变量分布方式的图。
8.2.1 针对降维分析的可视化
注意:
指定参数
指定参数
show可以从p12、p13、p23三个维度观察降维结果并提供html交互式图形展示。
🏷️示例:
MAE |>
  EMP_assay_extract('taxonomy') |>
  EMP_identify_assay(method='default',estimate_group = 'Group') |>
  EMP_collapse(estimate_group = 'Genus',collapse_by = 'row') |>
  EMP_dimension_analysis(method = 'pcoa',distance='bray') |>
  EMP_scatterplot(estimate_group='Group',show='p12html',ellipse=0.3)
